v1.5 — Windows · Linux · macOS (Apple Silicon) · MIT License

Your workstation deserves better than Task Manager.

Dofek is a system monitor built for developers running AI workloads — available as a TUI and a native desktop app. VRAM per process. Inference detection. Candlestick CPU charts.

TUI + Desktop·process management·built with Rust
D:\Development\dofek\target\release\dofek.exe
CPU10.2%
GPU22.6%
VRAM7056MB
MEM22.5%
ollama — inferring
CANDLE CPU 10.2% 60s
PROCESSES — sort: MEM
CPU
GPU
Util
0%
VRAM
7GB
MEM
Used
22%
NET
0 B/s
0 B/s

Most system monitors were designed before LLMs ran locally. They treat GPU as an afterthought and VRAM as a footnote. Dofek is built for what your workstation actually does today.

Variance, not just averages

Candlestick charts show CPU min/max/mean per time slot. Bursty spikes are visible. Steady load looks different from jittery load. No other monitor shows you this.

VRAM per process

The column Windows Task Manager doesn't have. See exactly which process is consuming your GPU memory — ollama, python, your game, your renderer — at a glance.

AI workload detection

Automatic inference/loading/idle classification for AI processes. Know whether ollama is actively generating, loading a model, or sitting idle — without checking logs.

See variance,
not just averages.

Every other monitor draws a smooth line and calls it a CPU chart. Dofek draws candlesticks — the same visual language traders use to read market volatility. Each bar shows the full min/max range and interquartile spread for that time window.

  • Wick spans the full min/max range per 500ms slot
  • Body shows the P25–P75 interquartile spread
  • Thick tick marks the mean value
  • Threshold lines at 80% (warn) and 90% (critical)
  • Switchable to area chart for GPU, MEM, and NET
CANDLE 10.2% AMD Ryzen 7 7800X3D

Your processes,
managed.

Tag processes as AI, DEV, or WATCH. Search, filter, group, and kill — all without leaving Dofek. Auto-detects known AI runtimes and dev tools, and lets you extend the list in your config.

  • ● AI — ollama, python, LM Studio, any VRAM consumer
  • ■ DEV — VS Code, browsers, terminals, build tools
  • ★ WATCH — your own pipeline processes, user-defined
  • / live search — type to filter by name instantly
  • t tree view — group by name with aggregate CPU/MEM/VRAM, expand to see individual PIDs
  • x kill — terminate single processes or entire groups, with confirmation
  • Filter tabs narrow the table without losing sort order
PROCESSES
NAMECPU%MEMVRAMSTATUS
PLUGINS
OLLAMA llama3:8b idle
→ Build your own plugin

Multi-GPU,
fully resolved.

Aggregate stats across all your GPUs in the ALL view, then drill into any individual card. The combined VRAM bar shows each device's share side-by-side. The main chart overlays both GPU utilization curves simultaneously.

  • Aggregated Util / VRAM / Temp / Power across all GPUs
  • Per-GPU tabs for individual device breakdown
  • Dual-color VRAM bar shows per-GPU contribution
  • Max temperature and summed power across all devices
  • GPU overlay on the main chart shows both curves
GPU

Prefer a window?
We built that too.

The desktop edition is a Tauri-powered native app with the same real-time data engine and trading-terminal aesthetic. Mouse interaction, resizable panes, and a windowed layout that sits alongside your other tools.

  • Resizable chart and watchlist panes via drag handle
  • Candlestick and horizon chart modes with tab switching
  • Process search, tree view, click-to-select, kill with confirmation
  • Full keyboard shortcut support (same bindings as TUI)
  • Lightweight — Tauri, not Electron. Small binary, low overhead
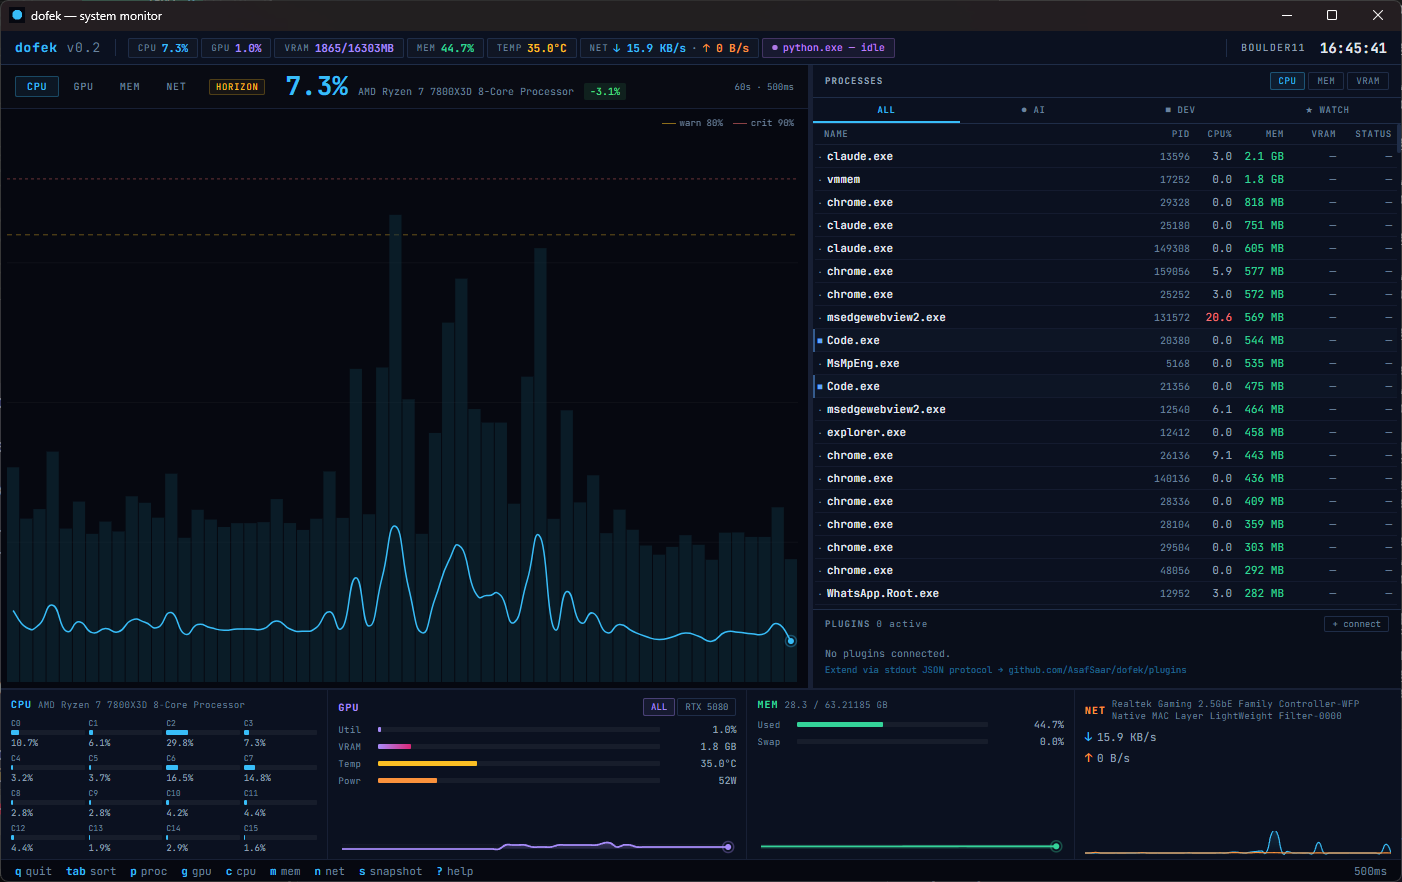
Dofek — system monitor
Dofek desktop GUI

The viral engine.
Build what Dofek doesn't ship.

Any process that writes JSON to stdout can be a Dofek plugin. One config line, and your plugin gets a live widget in the dock, process annotations in the watchlist, and metrics in the ticker bar.

# dofek.toml — one entry per plugin [[plugins]] name = "ollama" command = "dofek-ollama" args = ["--host", "http://localhost:11434"] # That's it. Dofek spawns it, polls it, restarts it on crash.
dofek-ollama official · v0.1

Loaded models, inference state, process annotations. See which model is running and what it's doing.

Download binary · README

dofek-docker official · v0.1

Running containers, image names, process annotations. Your compose stack at a glance.

Download binary · README

dofek-net-ping official · v0.1

Latency to a remote host, sampled between polls. Live ms / avg / loss in the dock and a latency pill in the ticker.

Download binary · README

build your own any language

Python, Rust, Node, Go — read the plugin dev guide and build one in under 50 lines.

QUICK START

Up in three steps.

01 — INSTALL
Get the binary
macOS (Apple Silicon) — install via Homebrew tap. Both the CLI and the desktop GUI are published. Windows / Linux — grab the installer from GitHub Releases (.msi, .deb, .rpm, or .AppImage). On macOS the unsigned .app may show "Dofek.app is damaged" on first launch — strip the quarantine flag once with xattr -dr com.apple.quarantine /Applications/Dofek.app.
# macOS — CLI bundle (TUI + plugins)
brew install AsafSaar/dofek/dofek

# macOS — desktop GUI app
brew install --cask AsafSaar/dofek/dofek
02 — RUN
Launch Dofek
Run the TUI from any terminal, or launch the desktop app. NVIDIA GPU metrics work automatically via NVML — no extra setup needed.
# TUI (terminal)
dofek-tui
# Desktop app — launch from /Applications or:
open -a Dofek
03 — OPTIONAL
CPU temperature on Windows
Run LibreHardwareMonitor as admin with the web server on port 8085. Dofek auto-detects it and pulls CPU temperature and power draw — data that sysinfo can't provide on Windows without elevation. Also serves as GPU fallback for non-NVIDIA systems. Linux skips this step entirely — CPU temps come straight from /sys/class/hwmon. On macOS, CPU temp/power and GPU/VRAM panels show N/A in v1.5 — Apple Silicon SMC and Metal integration are tracked for a future release.
View on GitHub →
THE DEVELOPER
AS
Asaf Saar
DEVELOPER · PRODUCT BUILDER
AI TOOLING

Asaf spends most of his time at the intersection of systems, AI tooling, and developer experience. When local LLMs became serious — models loading into VRAM, inference running in the background, GPU memory becoming a first-class concern — he found himself staring at Task Manager and coming up empty. The tool for this moment simply didn't exist.

Dofek is the result. Built in Rust because performance isn't optional for a monitor, designed around trading terminal principles because developers making real-time decisions deserve the same visual language as traders making real-time ones. Asaf believes the best developer tools are opinionated, visually sharp, and built by people who were frustrated enough to stop waiting for someone else to do it.