dofek is a system monitor built for developers running AI workloads — available as a TUI and a native desktop app. VRAM per process. Inference detection. Candlestick CPU charts.
Most system monitors were designed before LLMs ran locally. They treat GPU as an afterthought and VRAM as a footnote. dofek is built for what your workstation actually does today.
Candlestick charts show CPU min/max/mean per time slot. Bursty spikes are visible. Steady load looks different from jittery load. No other monitor shows you this.
The column Windows Task Manager doesn't have. See exactly which process is consuming your GPU memory — ollama, python, your game, your renderer — at a glance.
Automatic inference/loading/idle classification for AI processes. Know whether ollama is actively generating, loading a model, or sitting idle — without checking logs.
Every other monitor draws a smooth line and calls it a CPU chart. dofek draws candlesticks — the same visual language traders use to read market volatility. Each bar shows the full min/max range and interquartile spread for that time window.
Tag processes as AI, DEV, or WATCH. Filter the table to just the ones you care about. dofek auto-detects known AI runtimes and dev tools — and lets you extend the list in your config.
dofek.toml config| NAME | CPU% | MEM | VRAM | STATUS |
|---|
Aggregate stats across all your GPUs in the ALL view, then drill into any individual card. The combined VRAM bar shows each device's share side-by-side. The main chart overlays both GPU utilization curves simultaneously.
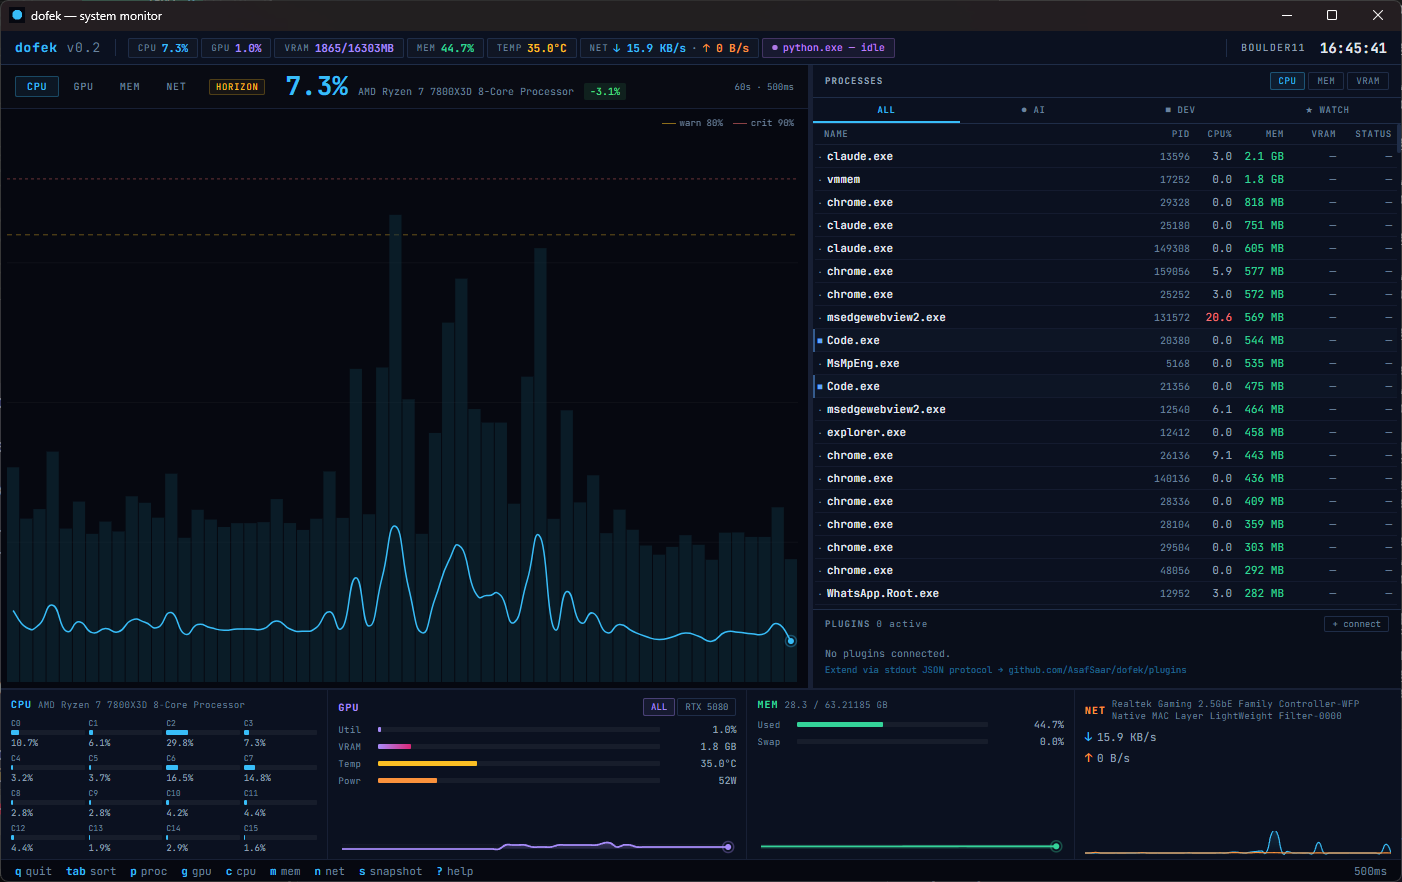
The desktop edition is a Tauri-powered native app with the same real-time data engine and trading-terminal aesthetic. Mouse interaction, resizable panes, and a windowed layout that sits alongside your other tools.
The planned plugin system will let any process that writes JSON to stdout become a dofek plugin. One config line, and your plugin gets a live widget in the dock. The protocol is intentionally minimal — here's what it will look like.
Token/s, context usage, active model, queue depth. Live inference metrics directly in the dock.
Container CPU/MEM per service, health status, restart count. Your compose stack at a glance.
LM Studio model status, GPU layer count, generation speed. For the GUI-local-AI crowd.
Rust, Python, Node, Go — any process that can write JSON to stdout can be a plugin. See the protocol docs on GitHub.
Asaf spends most of his time at the intersection of systems, AI tooling, and developer experience. When local LLMs became serious — models loading into VRAM, inference running in the background, GPU memory becoming a first-class concern — he found himself staring at Task Manager and coming up empty. The tool for this moment simply didn't exist.
dofek is the result. Built in Rust because performance isn't optional for a monitor, designed around trading terminal principles because developers making real-time decisions deserve the same visual language as traders making real-time ones. Asaf believes the best developer tools are opinionated, visually sharp, and built by people who were frustrated enough to stop waiting for someone else to do it.